| Step 1 | 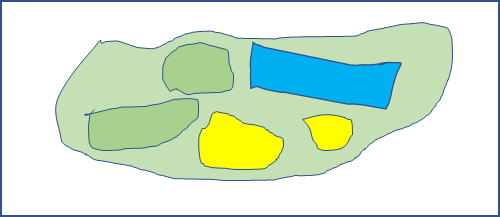 |
This is a map and target areas for your area survey. | |
| Step 2 | 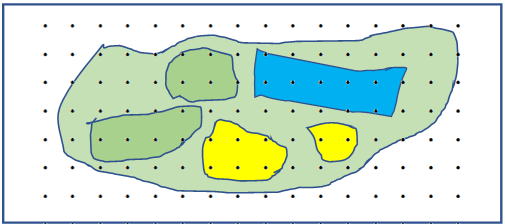 |
You put a dot-grid plate on the map. | |
| Step 3 | 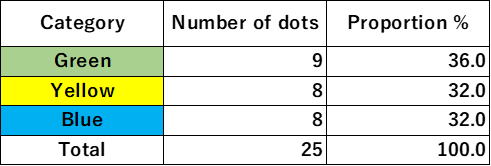 |
You count the number of dots by category (collar). | |
| Step 4 | 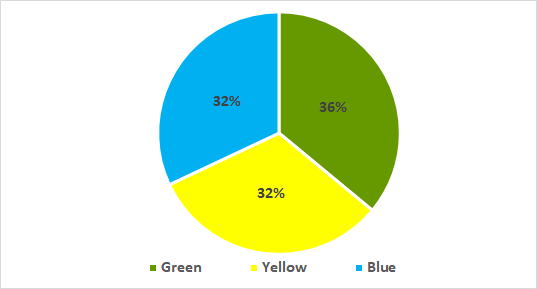 |
You try various analyzes. | |
| Dot Sampling Method Research Center | |||||
| 2 Basic idea/technique of the dot sampling method |
|||||
| Home | 1 List of web-materials on the Dot Sampling Method | 2 Basic idea of the method | 3 Materials issued by the Center | 4.Definition of area | 5 Question and Answer on the site |
| Dr. Frank Yates who is a statistician in England says in his book "Frank Yates, SAMPLING METHODS FOR CENSUSES AND SURVEYS, 1949" as follows. # If we have areas demarcated on a map, such as fields, and a point is located at random on the map, the probabilities of the point falling within the boundaries of the different fields are clearly proportional to the areas of the field. Consequently, areas can be selected at random with probabilities proportional to their size by the simple procedure of taking random points on the map. (35p) # All that is required for acreage is to determine the proportion of points which fall in areas of the given type. The method is therefore particularly attractive when carrying out surveys of the areas of crops, etc., by aerial survey, since it avoids all the measurements of 5 area which would be required if an ordinary random sample of areas were taken.(35p) #If accurate large-scale maps showing the field boundaries are available, the point method of sampling is very suitable for crop surveys in which contact with the farmer is not necessary. The fields with then act as sampling units, and selection will be with probability proportional to size.(82p) Dr. Kei Takeuchi who is a statistician in Japan says in his book "竹内啓 偶然とは何か、岩波新書" writtten in 2010, as follows. # As the number of dots N increases, dots scatter all over the inner part of a square and finally scatter thoroughly in a uniform manner. If you write a figure of S square units within a square of 1 square unit, becomes almost equal to S no matter what kind of figure it is, when the number of dots within the figure is n.(69p) # It is rather difficult to measure each area of every rice fields and total the area of respective rice fields in a certain map when there are lots of rice fields in various sizes. Better simple way is that estimating area by counting the number of dots fallen on rice fields after putting lots of dots randomly inside the map. If the number of dots which have fallen on rice fields is n out of N dots, total area of rice fields in the map is estimated of area of the map.(70p) The dot sampling method comes from those idea. The advent of Google Earth has made this idea a reality for us. See, "The dot sampling method" by Mr. Kamikura Kenji. Page4~Page5. |
2.2 Basic idea of the dot sampling survey method.
| Step 1 | |
This is a map and target areas for your area survey. | |
| Step 2 | |
You put a dot-grid plate on the map. | |
| Step 3 | |
You count the number of dots by category (collar). | |
| Step 4 | |
You try various analyzes. | |
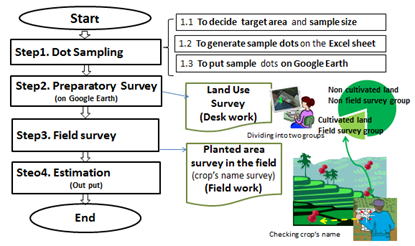
2.3 Procedure of the Dot sampling method for a planted area survey
| Based on the basic idea mentioned above, we designed the procedure of the
dot sampling method for a planted area survey in the Figure below. It consists of four steps. The first step is “dot sampling”, the second step is “preparatory survey”, the third step is “field survey” and the fourth step is “estimation”. To realize the idea, especially in the first step, we developed two techniques using Excel VBA. One is to generate the systematic random sampling dots on Excel sheet and the other is to put those sample dots on Google Earth. Details are shown on pages 4-9 of the next report, please see. Dot Sampling Method for Area Estimation |
 |
![]()